In case you weren’t aware, the financial industry has a long-standing feud within the family. On one side are those who advocate for low-cost, passive investing. On the other side are those who champion active investing.
What’s the difference? Passively managed mutual funds or exchange traded funds (ETFs) are those that are designed with two core beliefs. First, low cost. Second, simply try to replicate the returns of an index or benchmark (like the S&P 500, for example). Active funds are those that try to beat the benchmark or index to which they are compared.
In one corner stand the likes of Vanguard, DFA (short for Dimensional Fund Advisors) and iShares, among others. In the other corner, investing giants like PIMCO, Fidelity (although Fidelity has some passive funds as well), Loomis Sayles and more. So which side is right?
Let’s take a look.
Vanguard, the behemoth of the passive investing world (oddly, they do have a couple of actively managed funds), has a mutual fund called the Vanguard S&P 500 Index Fund (ticker symbol VFIAX and the ETF version is VOO). This fund is designed to simply track the performance of the S&P 500 minus Vanguard’s expenses, which are 0.05% (or what’s known as 5 basis points in the parlance of the investment industry). Just to give an example of how well this fund has done over the past 10 years in tracking its designated benchmark, VFIAX has a 7.88% return whereas the S&P 500 Index has a 7.89% return. So for costing 5 basis points, you have a fund that only underperformed the index by 1 basis point over 10 years (Source: Morningstar, as of 6/16/15). Pretty solid numbers.
Active investing is the idea that a fund can outperform the benchmark with adequate research. For example, American Funds is a very popular active fund family and they have a few different funds that compare to the S&P 500 Index. One of those is the American Funds Fundamental Investors fund, ticker symbol ANCFX (note, I used the version with no commission when purchased whose ticker symbol is actually ANCFX.lw). This fund has had performance of 8.92% vs the S&P 500 of 7.89% over the last 10 years (Source: Morningstar, as of 06/16/15). Pretty impressive stuff. In fact, that lands them in the best 7% of all funds in the category.
That’s a really good outcome. But what about active funds that underperform? Davis NY Venture is a great case study here. They are extremely popular with over $16 BILLION in the fund. The fund managers are highly regarded in the industry and Davis has had a number of funds with really good performance through the years. Yet, over the same 10 year window ending 6/16/15, Davis NY Venture (NYVTX.lw) had a return of 6.49% relative to the S&P 500’s 7.89%.
This little experiment highlights the conundrum active fund investors are faced with. On the one hand, you get the opportunity for outperformance. On the other hand, you get the very real possibility of underperformance.
How real of a possibility of underperformance?
S&P (short for Standard and Poors) releases their SPIVA research every year that shows how active funds do relative to their benchmark. Amazingly, very few funds actually outperform their benchmarks over extended periods of time (10 years or longer for our purposes).
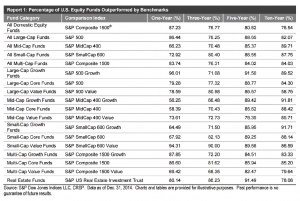
Here are their results from the most recent release for US stock indices:
Take a look at line 2 where it shows the S&P 500. The chart is basically stating that the index itself, the S&P 500, outperformed 82% of all active funds measured against it over the 10 year window ending 12/31/14. As you can see, the same general theme holds true across all US asset classes listed with the exception of the S&P 500 Value category.
S&P also publishes data on international stock markets and bond markets. Suffice it to say, with the exception of a few categories, benchmarks outperform regularly.
Now, this isn’t to say that active investing is terrible or should be outlawed. As the chart clearly illustrates, active managers outperform their benchmarks all of the time. In every single category, in fact. Just not that many of them.
As an investor, it becomes incredibly difficult to find active managers that will outperform IN THE FUTURE. It’s very easy to go find the best performers of the past 5, 10 or 20 years (as I did by picking American Funds in my example), but predicting which ones will outperform in the future is one heck of a difficult task.
That said, by now, you’ve probably figured out that I’m an advocate of passive investing. But it’s not because I don’t think active managers can outperform. I just think it’s difficult to figure out which ones will. Last time I checked, my crystal ball was broken. Yours probably is too.
More importantly, the reality is that most people want to abandon ship when an active fund underperforms. What happens if you pick an active fund and it has 1, 3, 5 or 10 years of underperformance? Will you stick with it? Or will you want out to buy something else that has performed better recently? If you want out, you’d basically be doing performance chasing. Said another way, you’d be buying high and selling low…the opposite of what you actually want to do.
Look at it this way, 84% of the time (the average of the 10 year performance numbers in the chart above) you’d be better off by simply tracking the benchmark. Sure, you can do better. But man, 84% is good. Are you better than 84% of your peers at your own profession? Maybe. Maybe not. If not, wouldn’t you like to be?
Now, that takes care of passive investing at the FUND LEVEL. Join me next time as I discuss how making active decisions at the PORTFOLIO level is where I see the real value. Confused? You won’t be…

